Debugging Techniques in Oracle Application Framework (OAF)
- Use System.out.println
When running the OA Framework pages from jDeveloper itself, you can
write debug messages using System.out.println.
These debug messages will be displayed in the console of jDeveloper.
Pro
- Ease of use, as you simply enter free text messages
- Debug messages simply appear without the need to set any profile
options
Cons - Too much typing, which can be avoided when using the debugger
of jDeveloper. - You can debug only those pieces of code that you suspect are
causing the error. Unlike to this approach, using jDeveloper debugging,
breakpoints can be set for exceptions/classes as well.
2. Use jDeveloper inbuilt Debugger
Pro
To get started just one breakpoint is required, as more and more
breakpoints can be added in runtime itself.
You can set generic breakpoints, for example, you can set breakpoint on
exceptions, which will take you to the exact line of code from where the exception
was being raised
jDeveloper makes it possible to try different scenarios, for example, you
can change the variable values at runtime
Cons
Given that you do not have source code of base classes, debugger usually
dives into those classes without giving many visible details. One may find this
annoying.
Some versions of OAF will raise exceptions[caught internally by Oracle] like
Classcastexception even before the page renders.
Debugger often pauses when those exceptions are raised. This can be
overcome by clicking on “resume button” of debugger.
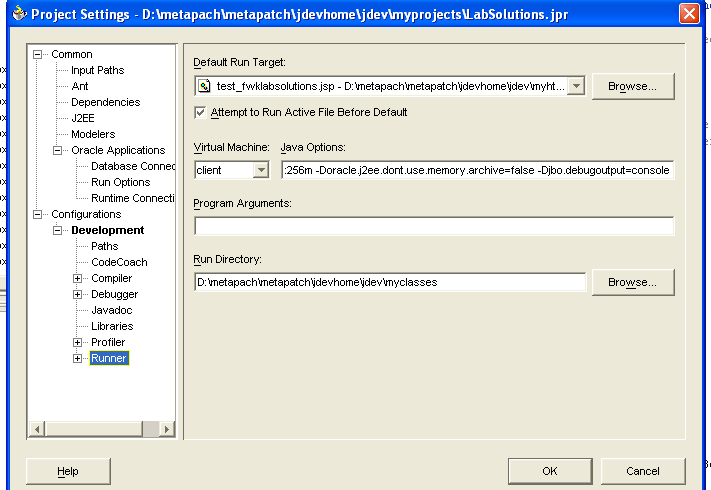
3. Use jDeveloper debugging feature, by changing Java VM runtime option -Djbo.debugoutput
If we wish to find the exact piece of SQL Statement that my screen fires, when doing an update.
In order to do so, we can append text -Djbo.debugoutput=console to runner property
4. Use the FND Debug Logging feature, to see debug messages on the OA
Framework Screen itself
The debug messages can either been seen on the same screen or those can be spooled into a table named FND_LOG_MESSAGES
In jDeveloper, you must include OADiagnostic in the “Run Options”.
This is effectively similar to setting profile option “FND Diagnostics” to Yes in eBusiness Suite.
Using this option, you will be able to click on Diagnostics to enable On-Screen display of debug messages

*This approach is the most useful when investigating red coloured error message “Please contact your system administrator.
*The debugging is limited to the debug messages in place. To maximize the listing of debug messages, try to use statement level debugging
5. Use FND Logging profile options to capture debug messages into a table
named FND_LOG_MESSAGES
Use the FND Debug Logging feature, to see debug messages.
The debug messages can either been seen on the same screen or those can be spooled into a table named FND_LOG_MESSAGES
FND: Debug Log Enabled
FND: Debug Log Module
FND: Debug Log Level
SELECT *
FROM fnd_log_messages
WHERE user_id = 209122 /your FND_USER user_id here/
AND TIMESTAMP > SYSDATE – .3
ORDER BY log_sequence DESC /note the order by clause here/
6. Use raiseDeveloperException
You can raise debug messages to be displayed in OA Framework pages using Raise Developer Exception. By doing so, your debug messages will be visible onto the top portion of the Screen. This is very similar to System.out.println, however the key. Difference being that raiseDeveloperException displays the de bug message on top portion of the page itself.
Pro
- Ease of use, as you simply enter free text messages
- Debug messages simply appear without the need to set any profile options
- Debug messages appear on the top portion of the page and hence the ease of visibility when testing your code in jDeveloper.
- Cons
- Too much typing, which can be avoided when using the debugger of jDev.
- You can debug only those pieces of code that you suspect are causing the error.